Interpretable Machine Learning for Child Stunting and Wasting Risk: A Cross-National Evidence Base for Programme Monitoring and Targeting
DECISIONS.md). This paper is honestly scoped as a
country-level driver and burden-classification analysis rather than an
individual-child determinants study, and states that limitation directly
rather than simulating individual records to avoid it. This is
independent research relevant to a programme monitoring role and is not
produced, reviewed, or endorsed by GAIN.
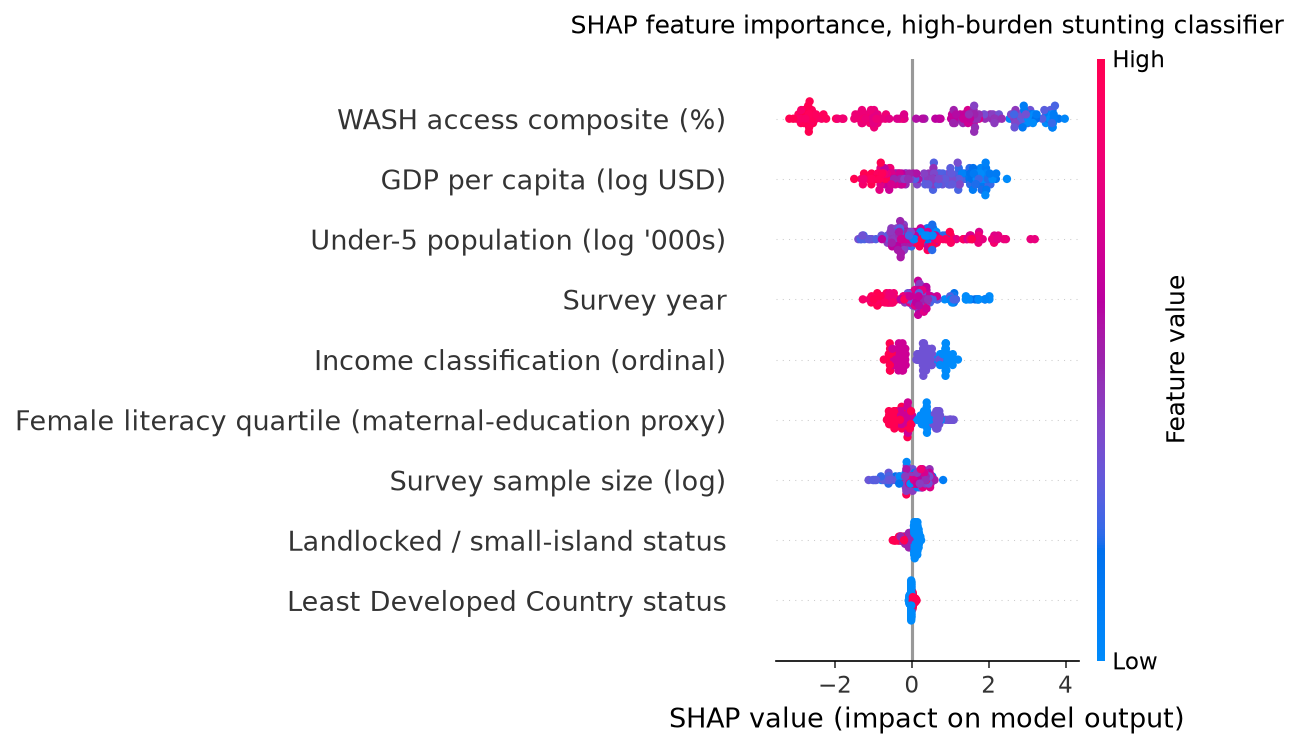
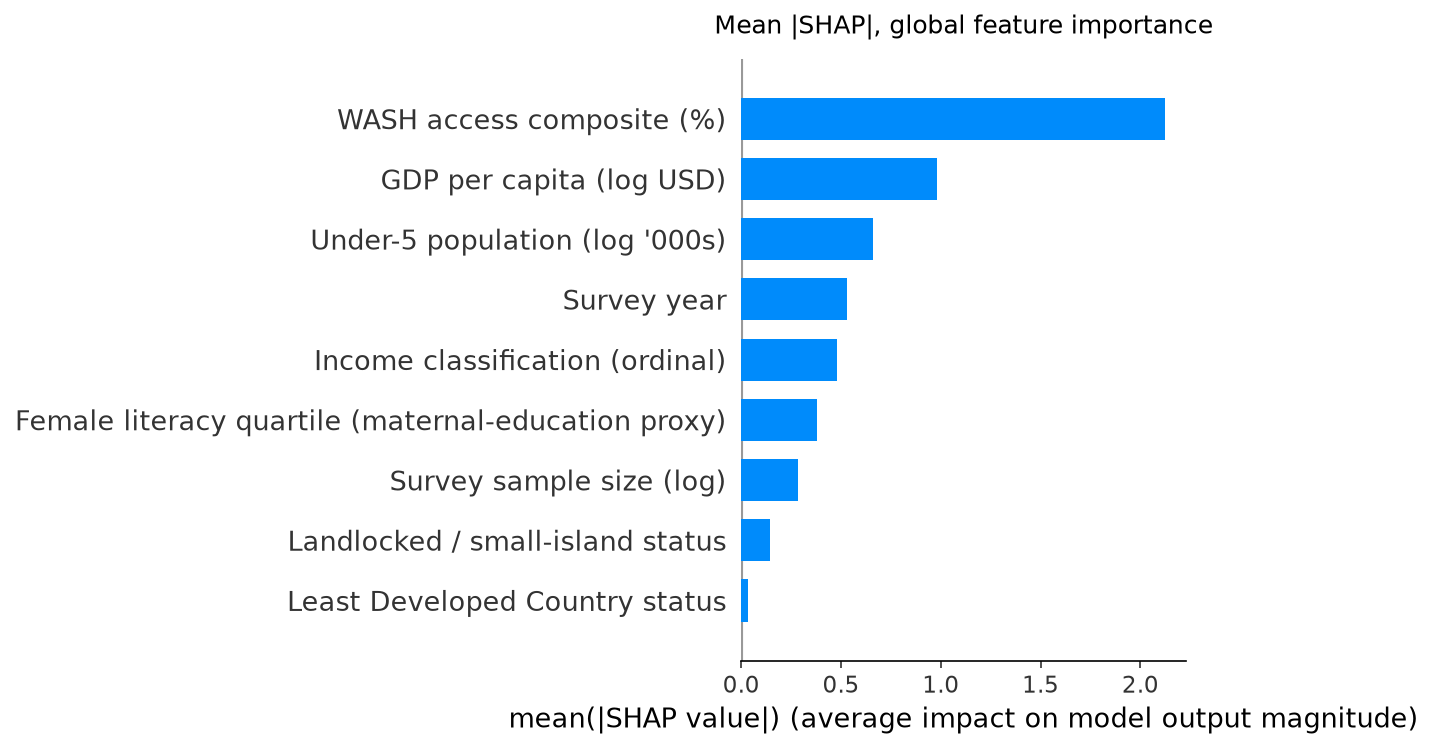
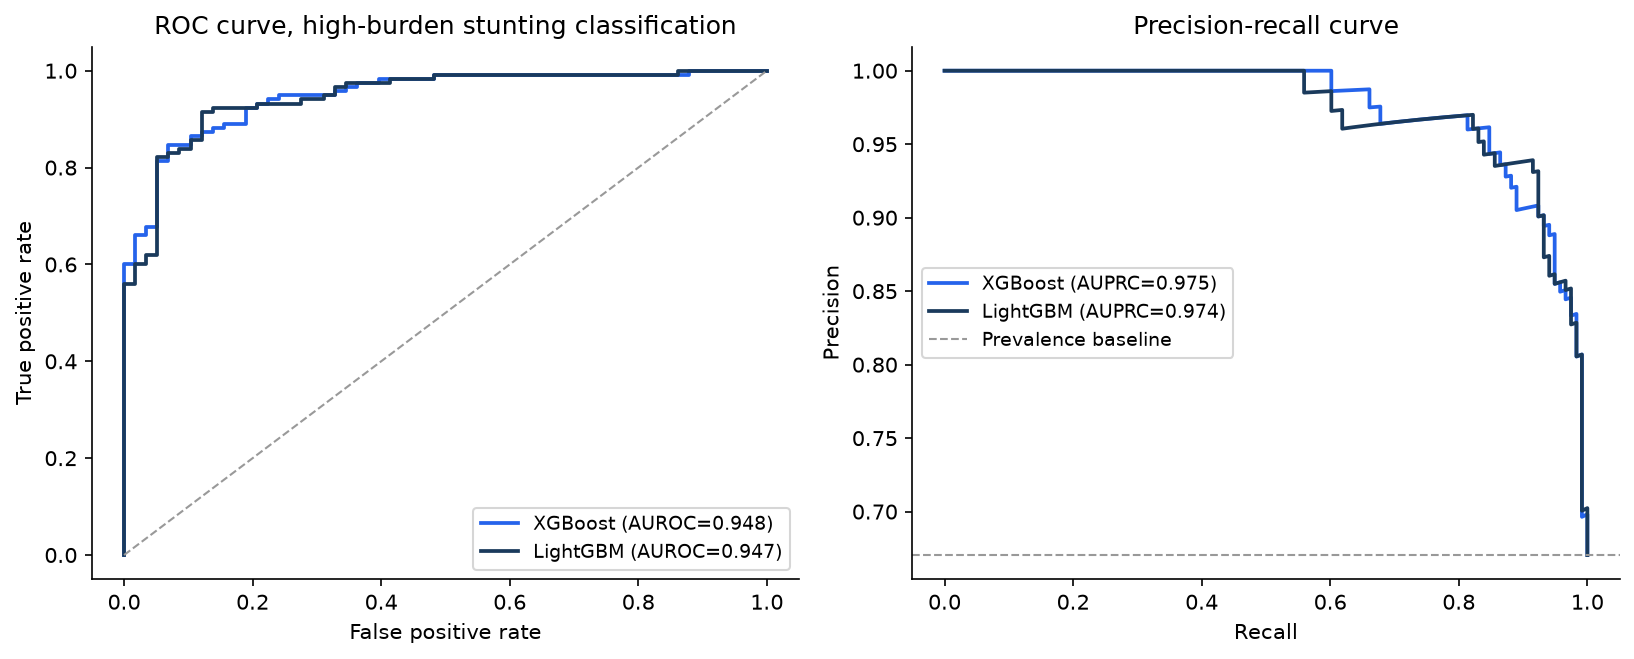
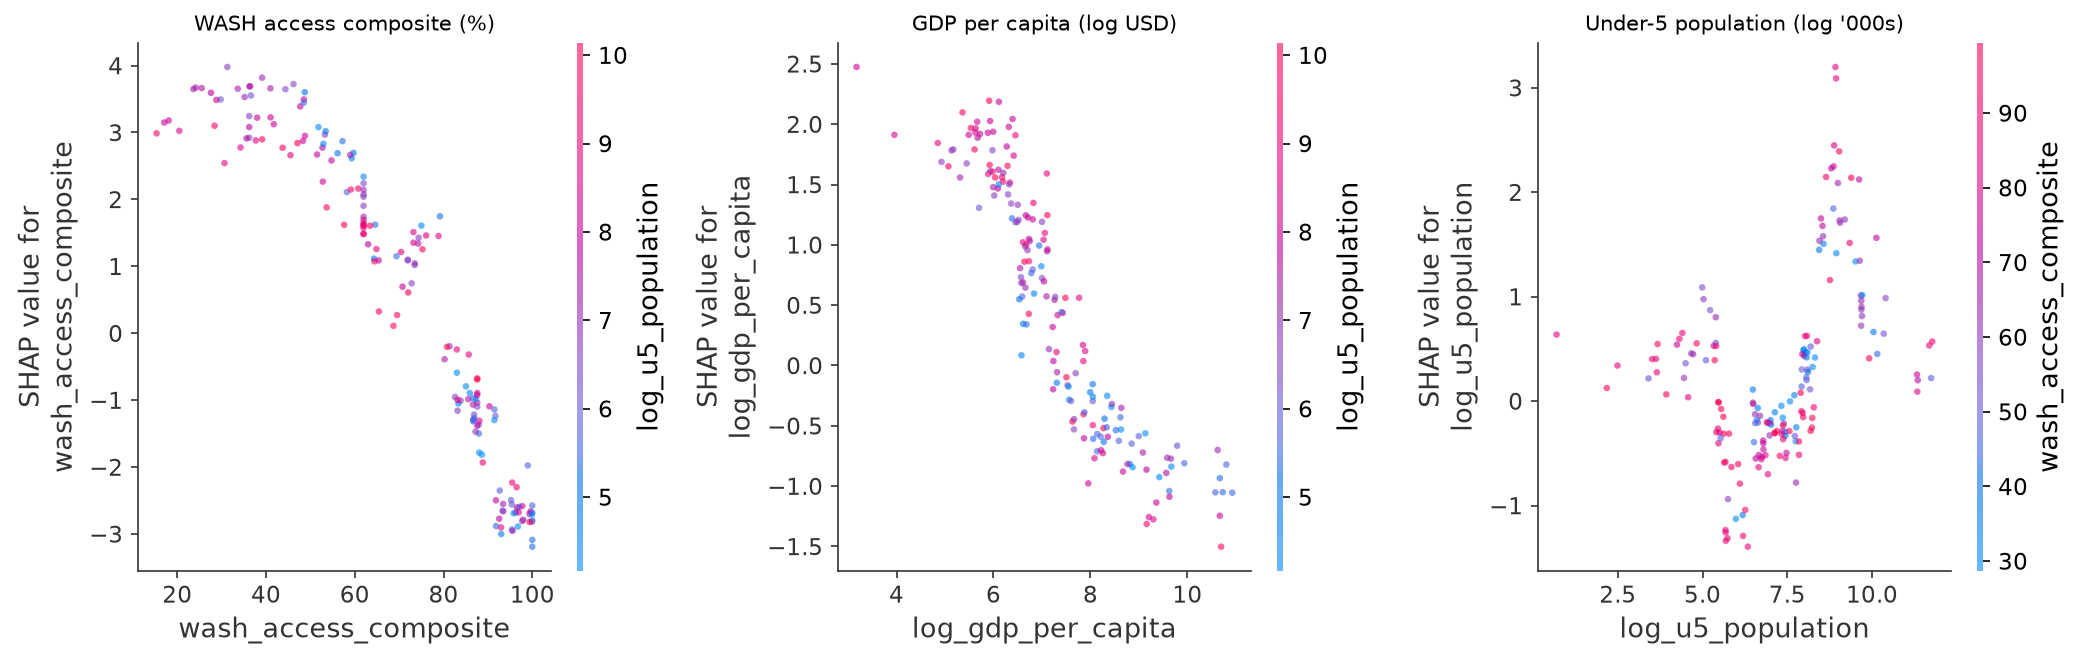
Key finding: A composite WASH access indicator (mean |SHAP| = 2.12) dominates the model, more than double the next driver, GDP per capita (0.98). An XGBoost classifier separates WHO high-burden stunting observations (prevalence at or above 20%) from lower-burden ones with AUROC 0.948. A parallel wasting model achieves AUROC 0.774, consistent with wasting's more acute, shock-driven character relative to stunting's chronic, structural determinants.
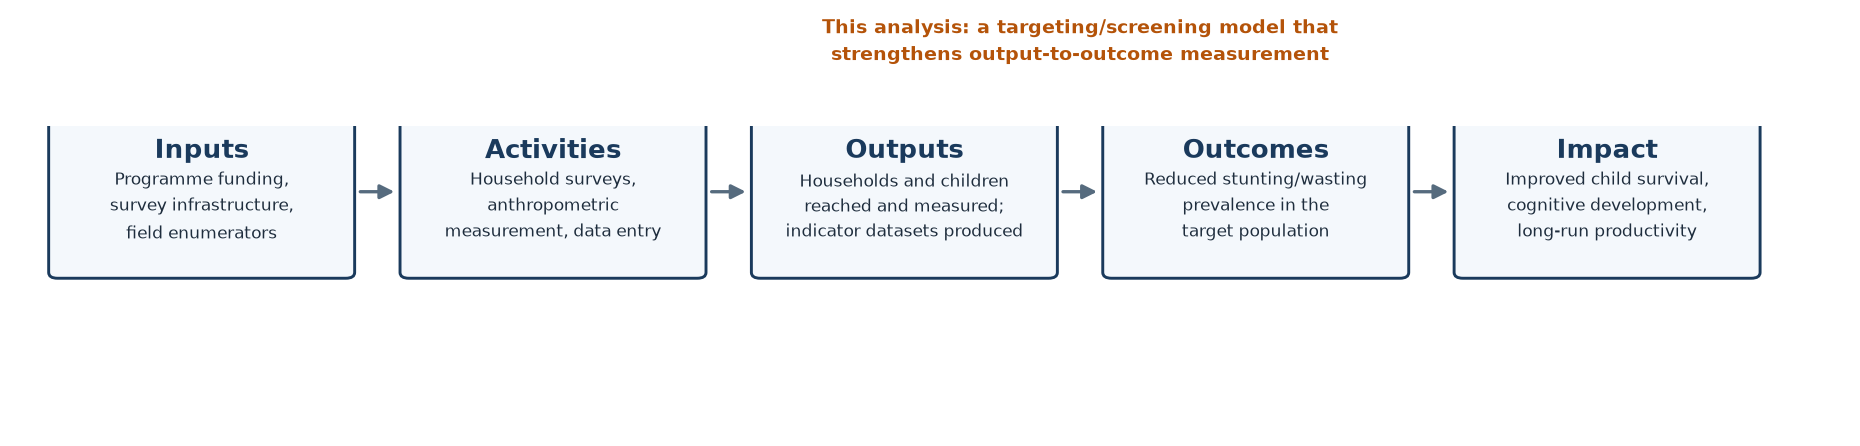
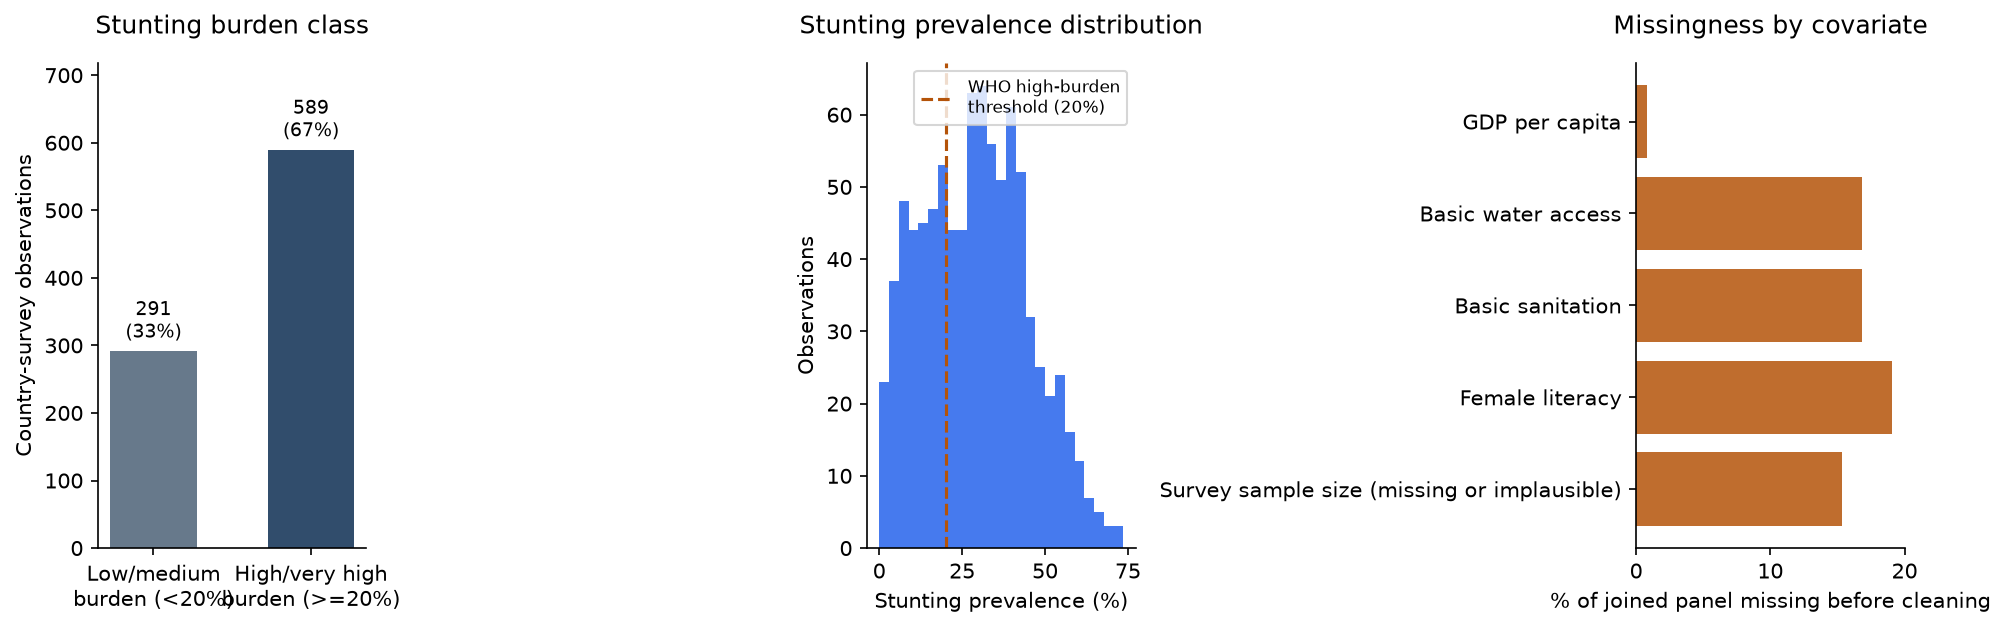
Programme teams that monitor child nutrition outcomes typically rely on periodic household surveys that arrive months after data collection and are reported at a level too coarse to guide week-to-week targeting decisions. This paper asks a narrower, programme-relevant question: given the country-level structural and survey-design information already available to a monitoring team at the time a survey is planned or released, can a model flag which country-survey observations are likely to fall in the World Health Organization's high or very-high public-health-significance category for child stunting, and which factors drive that classification. Using 880 country-survey observations covering 150 countries between 1983 and 2019, an XGBoost classifier separates high-burden from lower-burden observations with an AUROC of 0.948 and an AUPRC of 0.975. A SHAP analysis identifies a composite WASH access indicator, GDP per capita, and under-5 population size as the three dominant drivers. A parallel model for high-burden wasting achieves an AUROC of 0.774. The paper applies the USAID Data Quality Assessment framework (Validity, Integrity, Precision, Reliability, Timeliness) to the panel used here, and translates each SHAP-identified driver into a candidate output or outcome indicator that a programme monitoring system could track.
| Model (Target) | AUROC | AUPRC | Sensitivity | Specificity |
|---|---|---|---|---|
| XGBoost (stunting) | 0.948 | 0.975 | 0.873 | 0.879 |
| LightGBM (stunting) | 0.947 | 0.974 | 0.907 | 0.879 |
| XGBoost (wasting, secondary) | 0.774 | 0.550 | n/a | n/a |
Sensitivity and specificity reported at a 0.5 probability threshold on the primary stunting task's 176-observation holdout. The wasting model uses a separately stratified holdout at the WHO's 15% threshold.
@misc{ouma2026childnutrition,
  title   = {Interpretable Machine Learning for Child
             Stunting and Wasting Risk: {A} Cross-National
             Evidence Base for Programme Monitoring and
             Targeting},
  author  = {Ouma, Craig Carlos},
  year    = {2026},
  month   = {August},
  note    = {Preprint},
  url     = {https://craigouma.github.io/child-nutrition-shap/}
}